
The Foundation
AI is everywhere now. It's writing your emails, curating your feeds, putting fake Drake on Spotify, and maybe quietly applying for your job. It feels like it showed up overnight, hopped out of a lab in California, and just decided to take over the internet.
But artificial intelligence didn’t start with chatbots or billionaires. It’s not a brand-new invention. Calling it 'new' doesn't even come close when we start to pull back the layers.
The foundations of what we now call AI were laid down centuries ago by mathematicians trying to predict outcomes, draw patterns, and make better guesses with mathematical models. The AI we are experiencing today is just a remix of that powered by tremendous computing power scaling these models over monster datacenters. It's faster, louder, and a hell of a lot more expensive, but the bones are the same.
So to look through the cloud of AI hype, we've gotta rewind. Because to understand AI today, we need to look at what came long before the bots started talking back.
Before computers, advanced programming languages, and graphics processing units (GPUs) big enough to heat a city block, there was curiosity. Could you predict the future by studying the past That's where this all started.
Beginning in the 1700s, mathematicians and statisticians were obsessing over one basic idea: with enough data, could you reliably predict what's going to happen next?
These pioneers most likely didn't realize they were laying the groundwork for the most powerful technology to come. Generally, they were driven by practical applications like correlating weather patterns with crop yields, predicting the next observation of an astronomical event, and then going further to create the insurance industry.
So what's the general model they developed to enable the "sorcery" of peaking into the future? How'd they do it?
Regression
They did it with classic regression, a technique foundational to today's AI.
It's the chart you've seen that draws a line through a cloud of dots. Those dots being data points each representing a single event, an input and an outcome. The line cutting through them is the attempt to generalize the relationship between the inputs and output.
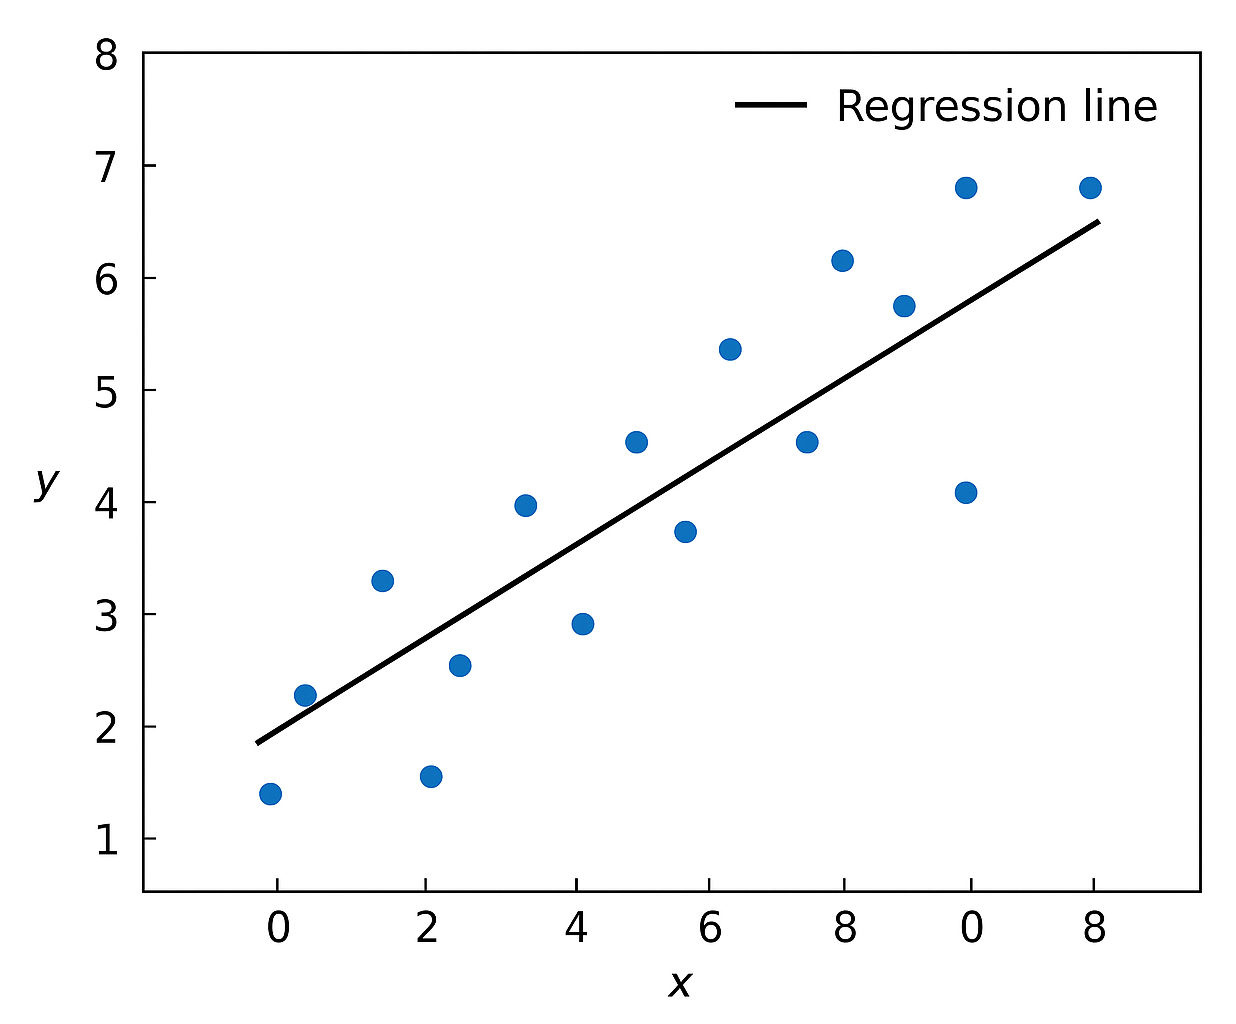
Well that line is the actual model used for prediction and is defined by the formula below.

This line isn't guessed or hand-drawn; it's created using a method called least squares. It sounds fancy, but it's just a smart way to make sure the line is as close as possible to all the dots in the dataset.
To start, we need to solve for the slope (β₁) of our line using the below formula. It might look complex, but every part of that formula has a clear job.
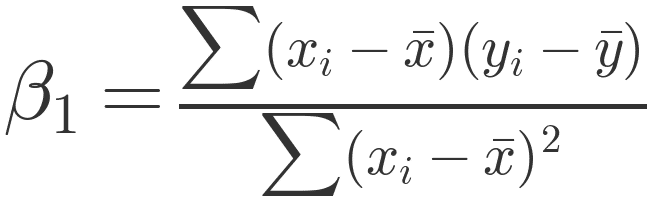
First, you calculate the average of all your inputs (X values) and your outcomes (Y values). This gives you the center point of your data: the average input and the average result. Your line will actually pass through this point.
Second, you need to see how the data is distributed relative to those averages. For each data point, you subtract the average input from the actual input, and do the same for the output. Then, you multiply those two numbers together. Do that for every data point and add them up. That gives you your numerator.
For the denominator, you only take the input differences for the X values and square them to prevent cancellation of positive and negative values. Do that for every data point and add them up.
Finally, divide the numerator by the denominator. That gives you the slope of your best-fit line informing you of the direction and steepness of the line.
Now we just need to figure out the y-intercept (β₀). We already have the average input, average output, and the slope. Plug it into this formula:

Boom. Now you know how to run a regression over a dataset all with simple math.
Now let's make it real.
Predicting Productivity
Say you have data measuring sleep and productivity. Sleep is our input variable measured in time and productivity is our output measured by tasks completed in a day. With this data, we have the goal to predict productivity based on the amount of sleep someone has.
We open up whatever program (even Excel can handle this), plot all of the data, run a regression knowing all the math behind it, and pops out your model.
It turns out the more sleep someone gets, the more productive they tend to be (up to a point). Our line says for every extra hour of sleep, productivity increases by 1.3 tasks, on average with a y-intercept at 2.

How does this predict? Just plug any sleep input (7.5) into the model and it will spit out the expected amount of completed tasks for that day (11.75). You now have a legitimate model that predicts productivity based on amount of sleep.
And this isn’t just a thought experiment. This is how companies model hiring decisions, evaluate performance, and set goals.
Could you expand on this model? Absolutely and you should! You could add other input variables like sleep quality and caffeine intake into the mix. Then, we get into multiple linear regression and start tooling around with feature scaling and cross-validation. Did you notice how easily we just built on top of our model? It goes deeper and deeper. That's been the story of AI.
Conclusion
The reason regression matters in this story is because it captures the core of what AI actually is: using past data to make future predictions.
Modern models perform impressively. Netflix recommends your next binge, META locks you into an infinite scroll, and Google reads your mind with ads. But the math? A lot of that is still regression under the hood.
The real leap wasn't math. It was scale. The same regression you just learned gets plugged into pipelines powered by datacenters the size of warehouses. Without these resources the AI you see today doesn't exist.
It started with math. It exploded with machines. And now that you understand that, we can start cutting through the noise and figuring out where AI is actually going.